Graphical Report- Question Difficulty Wise Performance
Every question paper has a mix of questions of different difficulty levels. In almost all cases, the test report shows the total marks received by the students and does not focus on the difficulty level of the questions. However, the Addmen OMR software can generate detailed graphical reports as per the difficulty level of the questions.
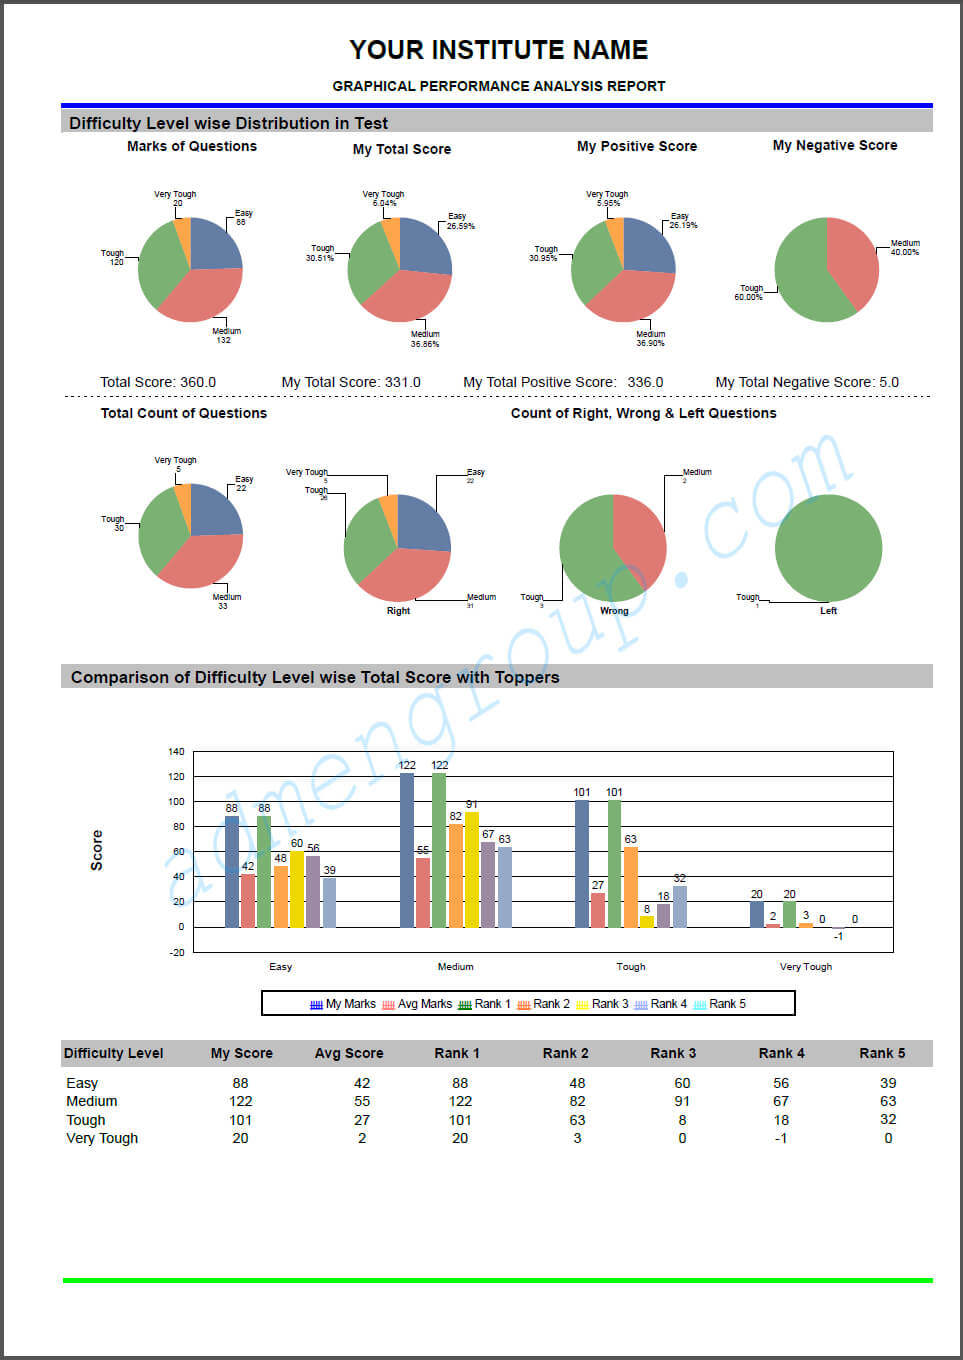
Overall Marks
- The graphical performance analysis report provided above provides the distribution of total marks of the tests in a pie diagram format.
- This is followed by the scores received by the student as per the difficulty level of the questions. The marks are represented in the form of percentage.
- Next to this comes the pie diagram with the positive scores received by the students as per the difficulty level of the questions. The negative scores are also distributed in the form of a pie diagram according to level of difficulty.
- The next section begins again with a pie chart that has number of questions in each difficulty level. The difficulty levels include easy, medium, tough and very tough.
- This is followed by three pie diagrams that represent the count of right, wrong and left questions of the student.
- The next section consists of a bar diagram that compares the difficulty-wise scores of the students with that of average marks and top five marks. The same is represented in a tabular format too.
|